- UX for AI
- Posts
- How to Design UI for a Curve Shape Anomaly
How to Design UI for a Curve Shape Anomaly
Dive into the complexities of curve shape anomaly detection, offering practical insights and real-world applications. From understanding the nuances of curve shapes to implementing AI models for autonomous decision-making, this article equips you with the knowledge to design effective UIs for any scenario.
Greg Nudelman
February 13, 2024
In the previous installment, Digital Twin: https://www.uxforai.com/p/digital-twin, we discussed how to model the AI’s view of the real world using incoming metrics, create models, and display AI predictions. In this installment, we are going to show you how to create a UI for a Digital Twin for a more complex dynamic use case: curve shape anomalies. Simple time-series metrics like heart rate, incoming current, or temperature can be easily measured, and we can track peaks and throughs as well as some periodic patterns to detect contextual and drift anomalies, as we discussed here: https://www.uxforai.com/p/contextual-and-drift-anomalies.
However, some of the most interesting data is generated by Dynamic Systems, meaning it’s difficult to figure out what is going on in the system by looking at an absolute measurement. Such dynamic data must first be modeled and plotted so it can be analyzed. Using AI trained on various curve shapes, we can use AI models to automatically determine the state of the system using the shape of the curve and authorize the AI to take appropriate remediation action.
Horse-Head Oil Pump
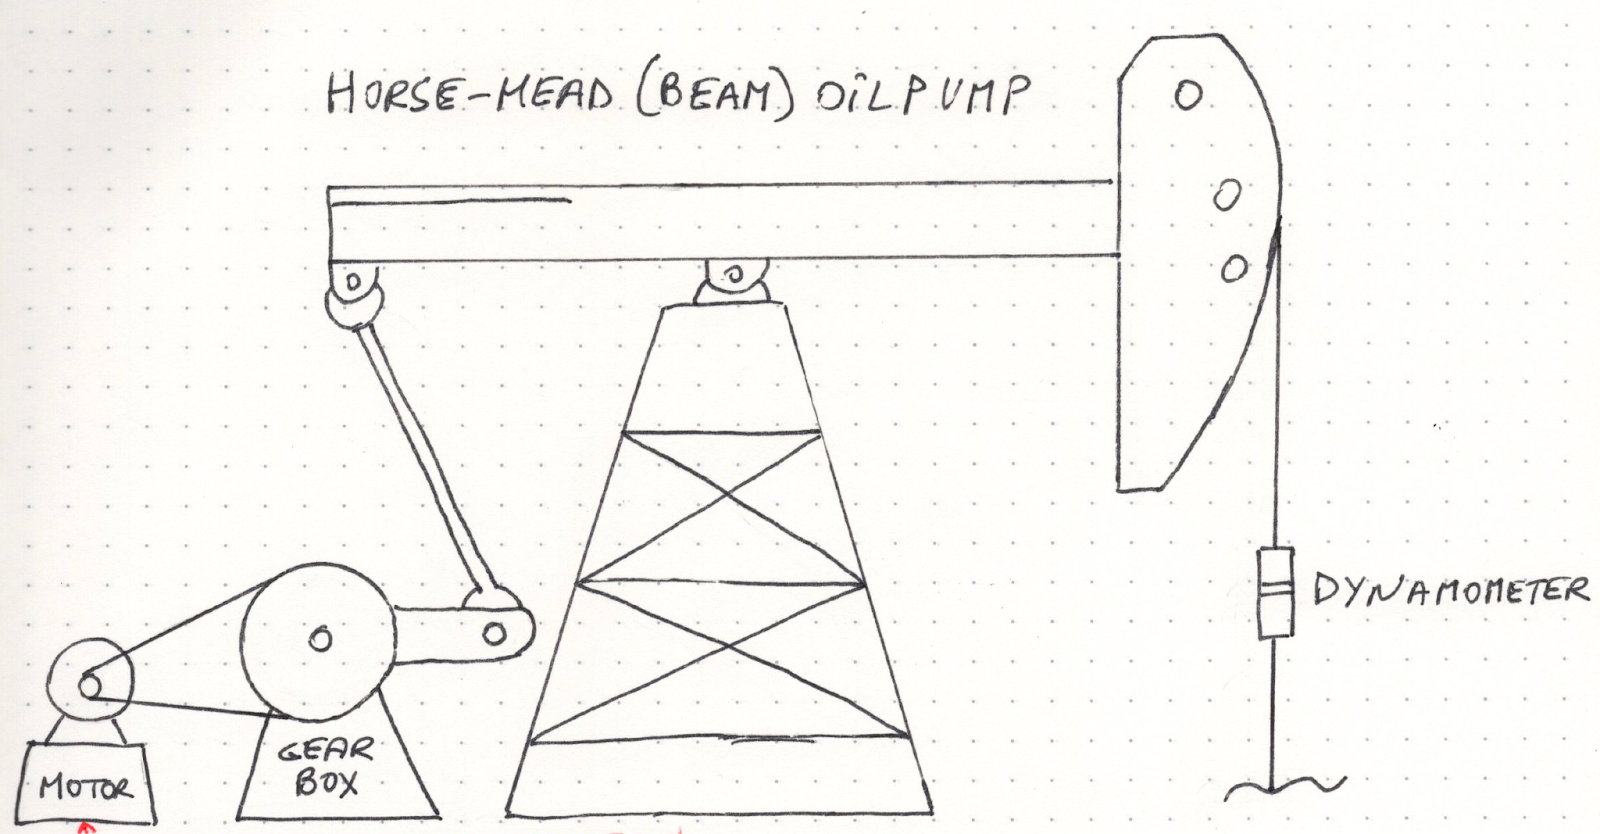
One of the most commonly used types of oil pumps is the Horse-Head or Beam oil pumpjack, invented by Walter Trout in 1952. The original design is much older, however – harking back to the ancient Chinese irrigation systems: https://oilpro.ca/5-interesting-questions-about-pumpjacks-answered/
The electric motor spins the gearbox, which oscillates the beam, making the horse-head (and the attached rod) move up and down, allowing the pump to bring oil to the surface:
What interests us is what happens deep in the well, or “downhole.” Many different things might happen deep in the ground in a dynamic environment where we are continuously trying to bring several tons of viscous material to the surface. For the sake of brevity, let’s look at just one very common anomaly condition called “pounding.”
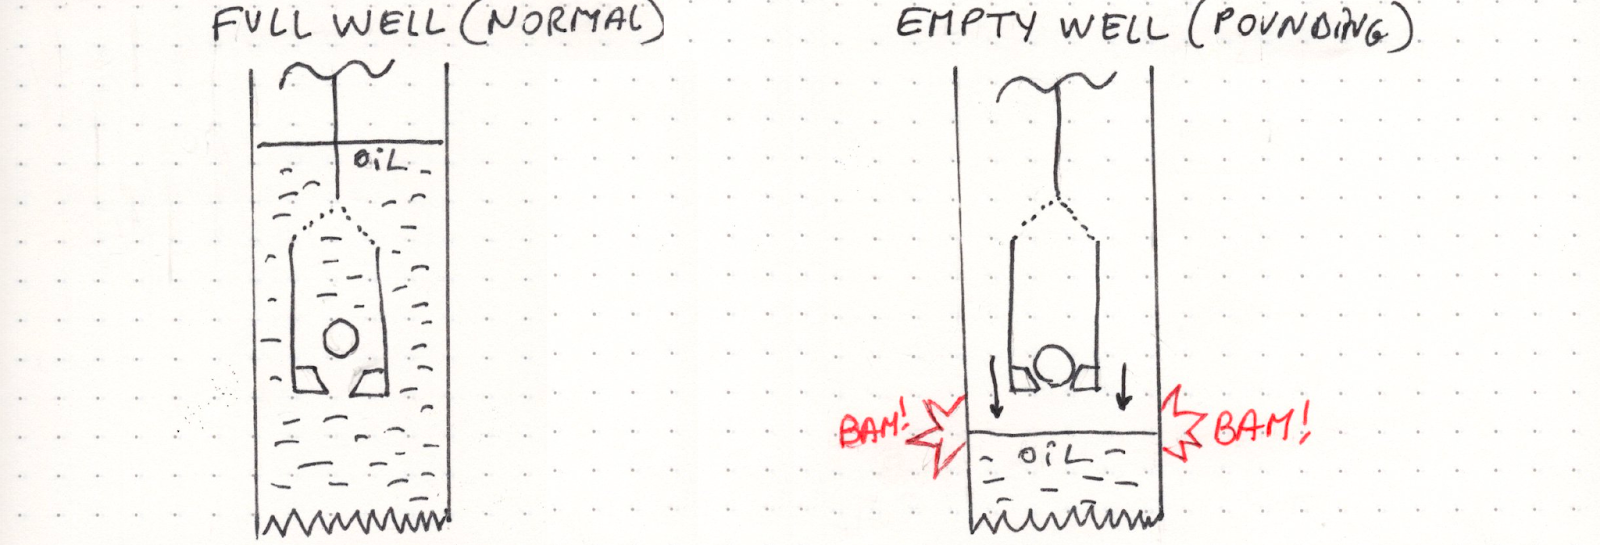
Imagine for a moment a water well with the attached bucket on a rope. In the picture on the left, the well is full, so the bucket sits all the way in the water. Moving the bucket up and down is smooth because the bucket never breaks the surface of the liquid. In contrast, the picture on the right shows an almost empty well. The bucket in this picture slams down on the surface every time it is moved up and down.
Oil is much more viscous than water, so “pounding” the surface of oil with a bucket is not only non-productive (as it does not help move the oil to the surface) but will very quickly cause the delicate rod and bucket system to break!
Many wells that are pumped at a fast pace run low and need a bit of time to fill up again to prevent pounding. For this reason, we need a way to figure out what is happening “downhole” – a reliable way to detect that pounding is occurring so we can stop the pump quickly and wait for the well to fill up again. Not only that, we need a system to do this autonomously because oil wells are often spread out over a great distance in the desert or in other hostile environments (like, ahem, Bakersfield.)
AI-Driven Curve Shape Anomaly Detection
Fortunately, we have an excellent tool for the job – we can measure the force on the rod using a dynamometer attached to the rod and then (with a bit of fancy math) produce a nice graph called the “Downhole Dynacard” the shape of which can be used to diagnose many different conditions including “pounding.” The dynacard graphs look like this:
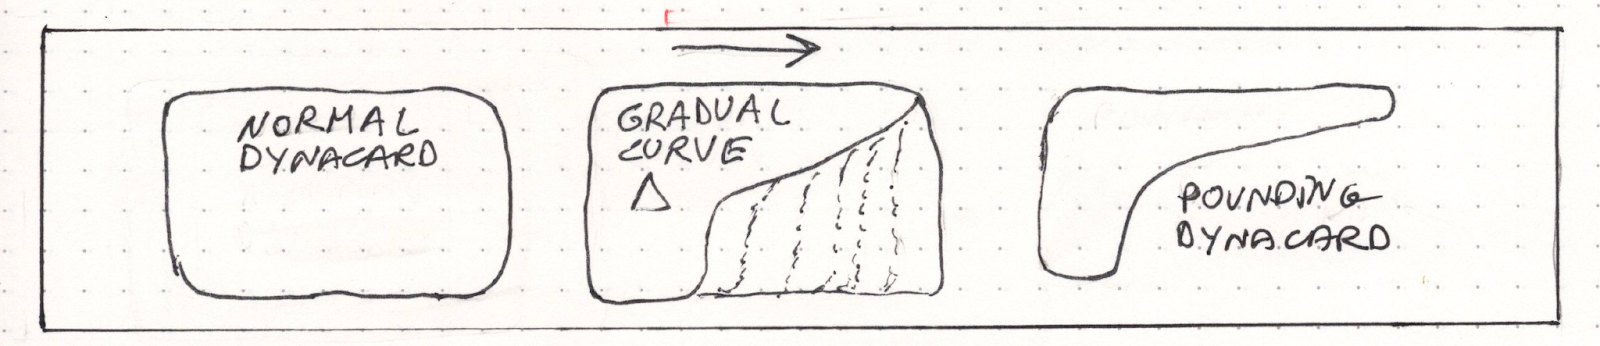
As you can see, the “pounding” dynacard is quite different from the normal “square” shape with rounded corners. AI can be trained to recognize various curve shapes and take appropriate actions (like turning off the pumping motor) when a certain condition is detected.
Complete Digital Twin
Here’s the complete operational diagram and Digital Twin for our Horse-Head Oil Pump:
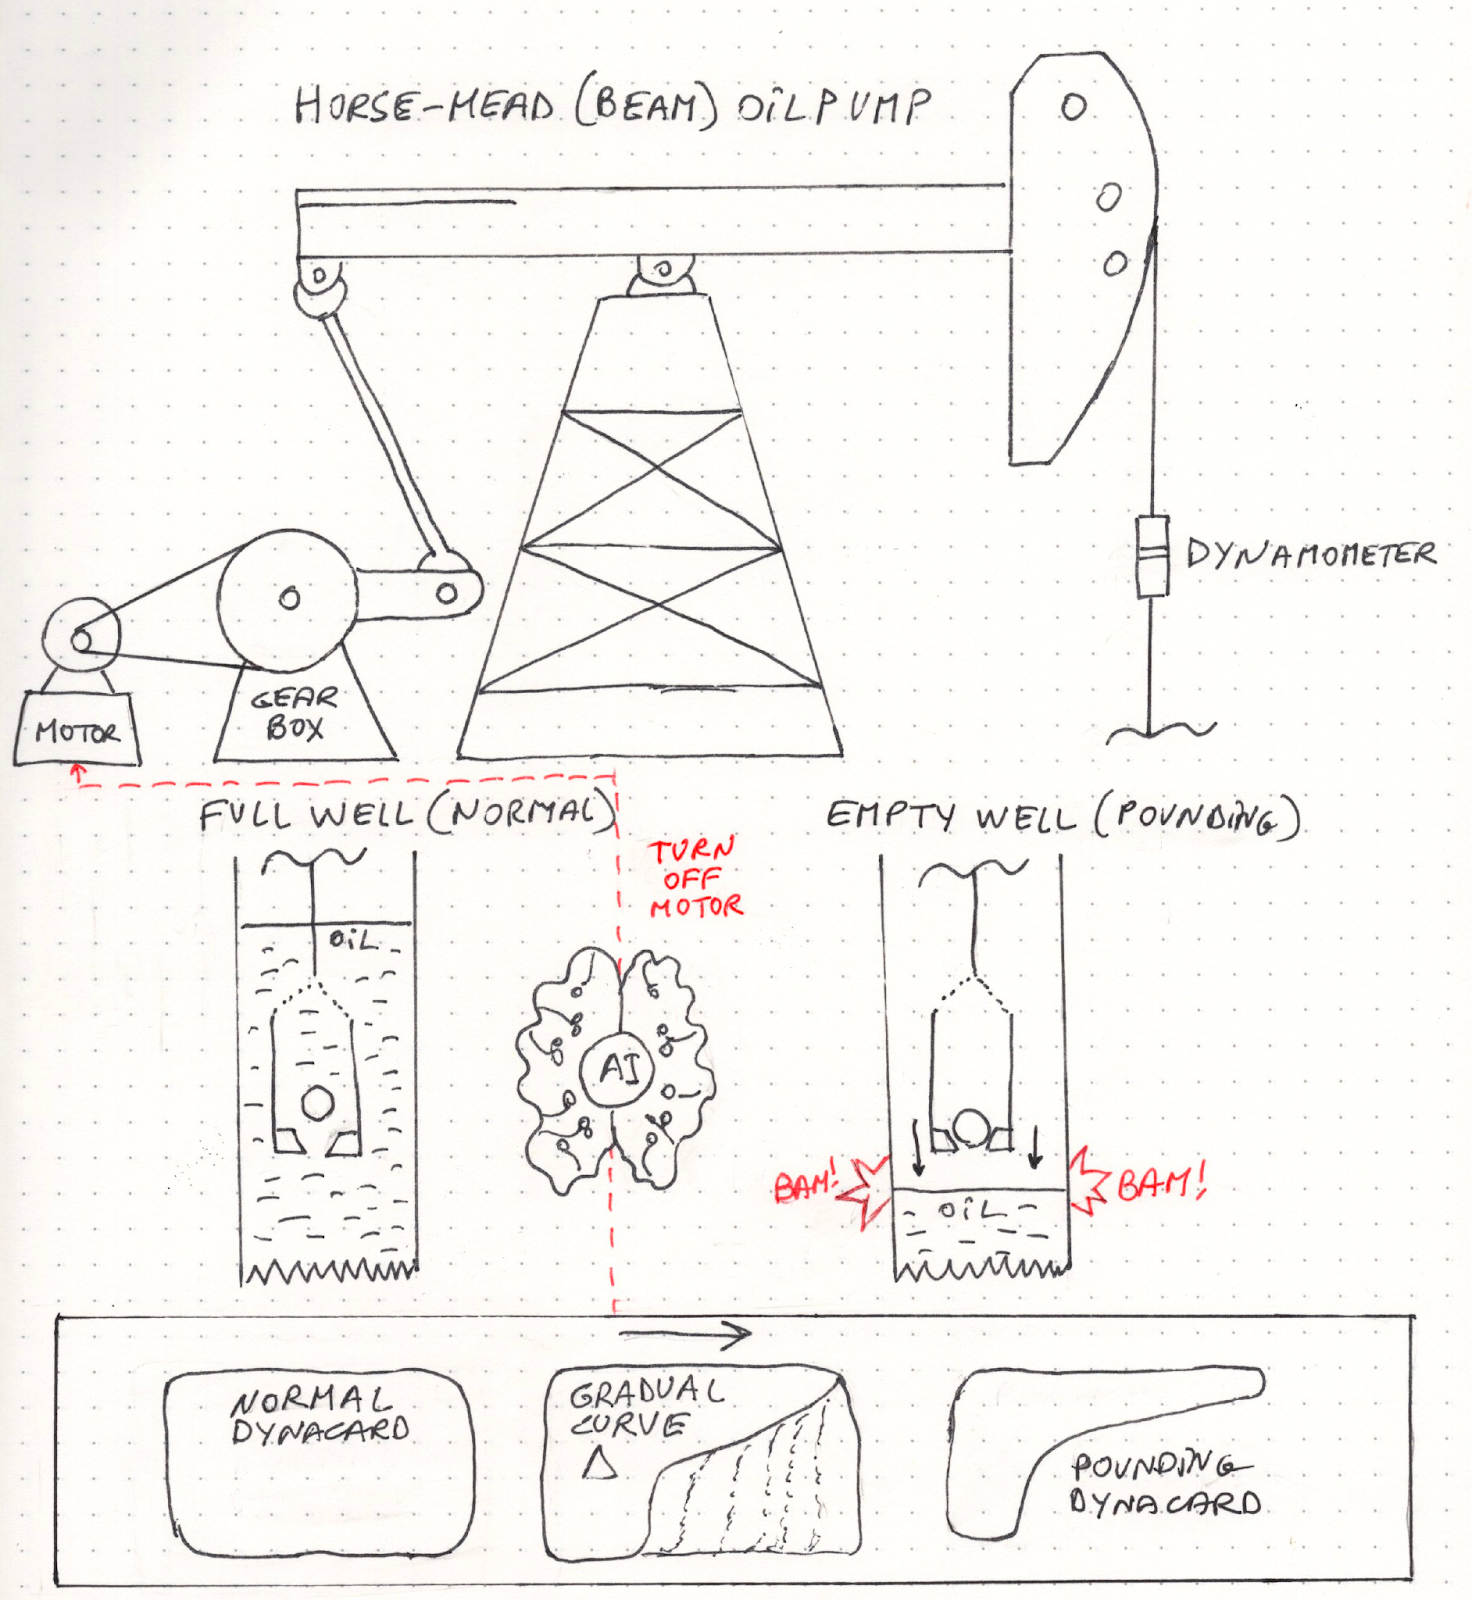
Digital Twin with Curve Anomaly Detection
What kind of UI do we need to control this system?
Interestingly, while the mechanism of detecting various conditions is fairly sophisticated, there is not much to the UI itself. Note that the curve does not change shape immediately but undergoes a gradual change. With each pump cycle, the curve changes slightly until… BAM! We got pounding. This slight change over time works to our advantage because we don’t need to take drastic action – we just want to minimize the extent of the long-term damage to the pump system. With each N pump cycles (say 10), we can use a fresh dynamometer reading to generate a downhole dynacard curve, which we can feed into the local AI “brain” to compare against a variety of dynacards the AI has been trained on. When the AI can answer with some measure of confidence that “pounding” is indeed occurring based on the shape of the curve, the AI can make an autonomous decision to stop the motor.
So the UI is actually quite simple. Using our short-hand method (more on that later), here’s everything we need:
Perform curve anomaly analysis each [10 times \/]
When the curve anomaly match confidence exceeds [90% \/],
perform the following action: [turn off the pump motor \/]
for the period of [10 minutes \/]
That’s it!
Diagnosing Many More Anomalies
In this article, we covered only the difference between the curves in Graph 1 (normal operation) and Graph 3 (“pounding”) shown below. The curve anomaly detection system used in the industry today is more sophisticated, with dozens of possible conditions that can be diagnosed by the AI and remediated via a specific set of predetermined actions:
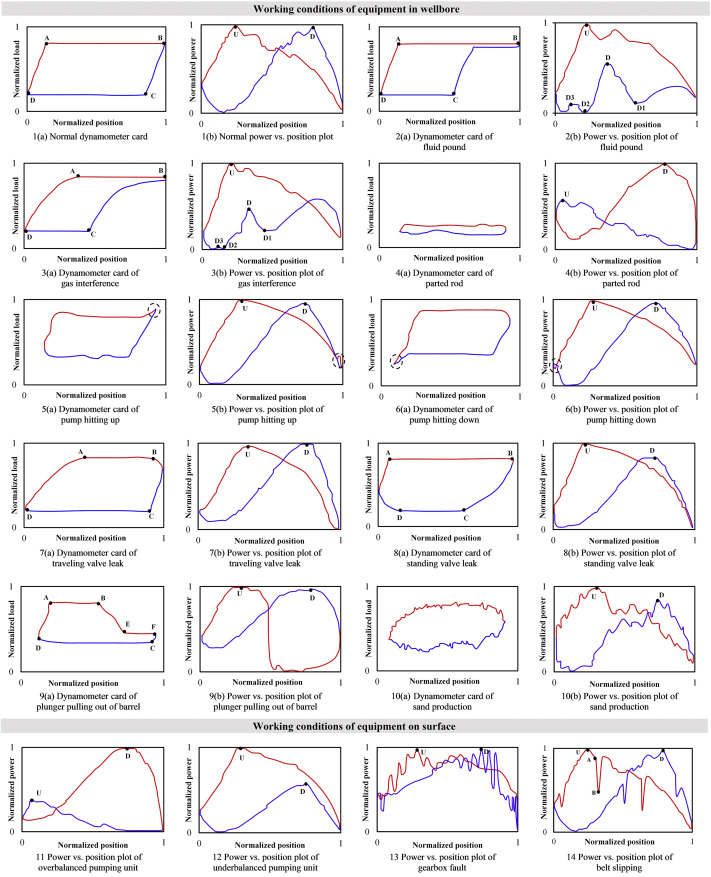
Here’s the reference, complete with all the mathematical fun:
Ruichao Zhang, Yuqiong Yin, Liangfei Xiao, Dechun Chen,
A real-time diagnosis method of reservoir-wellbore-surface conditions in sucker-rod pump wells based on multidata combination analysis, Journal of Petroleum Science and Engineering,
Volume 198, 2021, 108254, ISSN 0920-4105, https://doi.org/10.1016/j.petrol.2020.108254.
Happy… ahem… Designing!
Greg Nudelman & Daria Kempka (Contributing Editor)
Reply